iDD PULSE
PRODUCT STRATEGY / UX & UI / DEVELOPMENTA clearer pulse on
the whole business.
Connecting a dental group’s digital marketing, enquiries and reporting in one workspace.

01 / THE STARTING POINT
More businesses.
More places to look.
iDD Pulse began with a practical need: understand the digital marketing activity of more than seven dental clinics, an aligner brand and a dental laboratory, without starting from scratch in every platform.
The situation
Each business brought its own website, social profiles, advertising accounts and local search presence. Reviewing performance meant connecting information across those tools while keeping the business and reporting period clear.
The challenge
Bring that activity into one workspace without flattening the differences between channels. Support a quick management review, then make it easy to investigate the evidence behind it.
Business scope from the project brief. These figures describe the context, not a measure of product adoption.
02 / MAKING IT CLEAR
Start with context.
Then open up the detail.
I led the work from product strategy and UX/UI through development, integrations and the design system. The thread connecting those roles was the information hierarchy: what does someone need to understand before the next number is useful?
AI-assisted development supported the integration architecture and back-end implementation. I connected the business need with the working interface, then translated the product into an editable Figma system.
A visible business and period
Keep the selected context close to the metrics so users can see what they are reviewing.
An overview with a way in
Give management a starting point, with dedicated channel views for the questions that need more detail.
A place for the follow-through
Bring enquiries, monthly reporting, access management and assistance into the same workspace.
03 / THE WORKSPACE
The summary is only
the starting point.
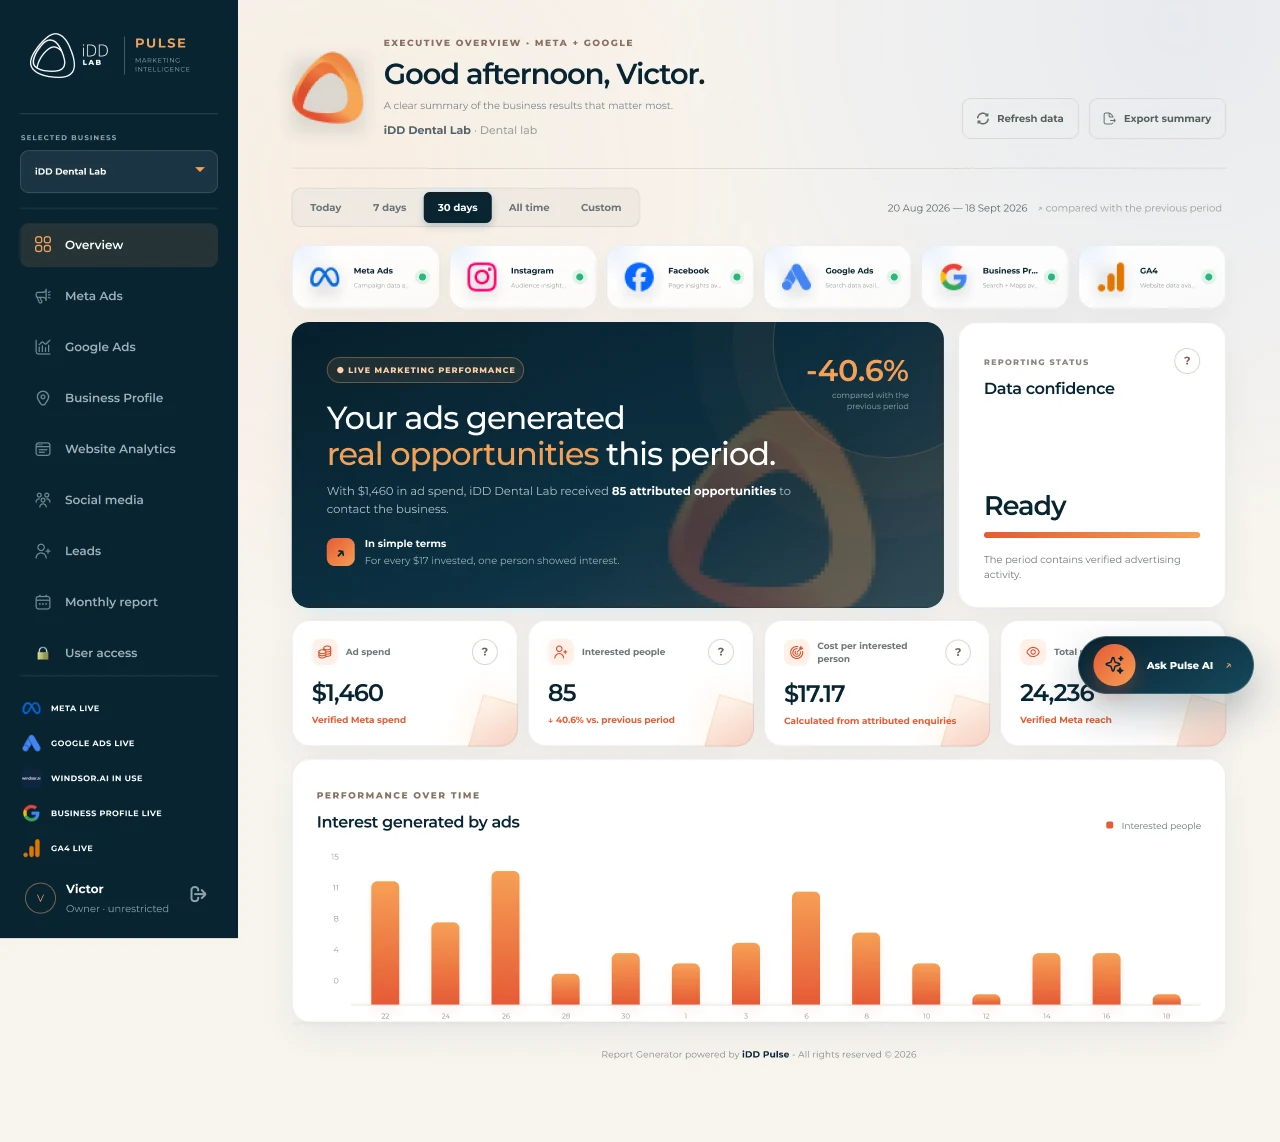
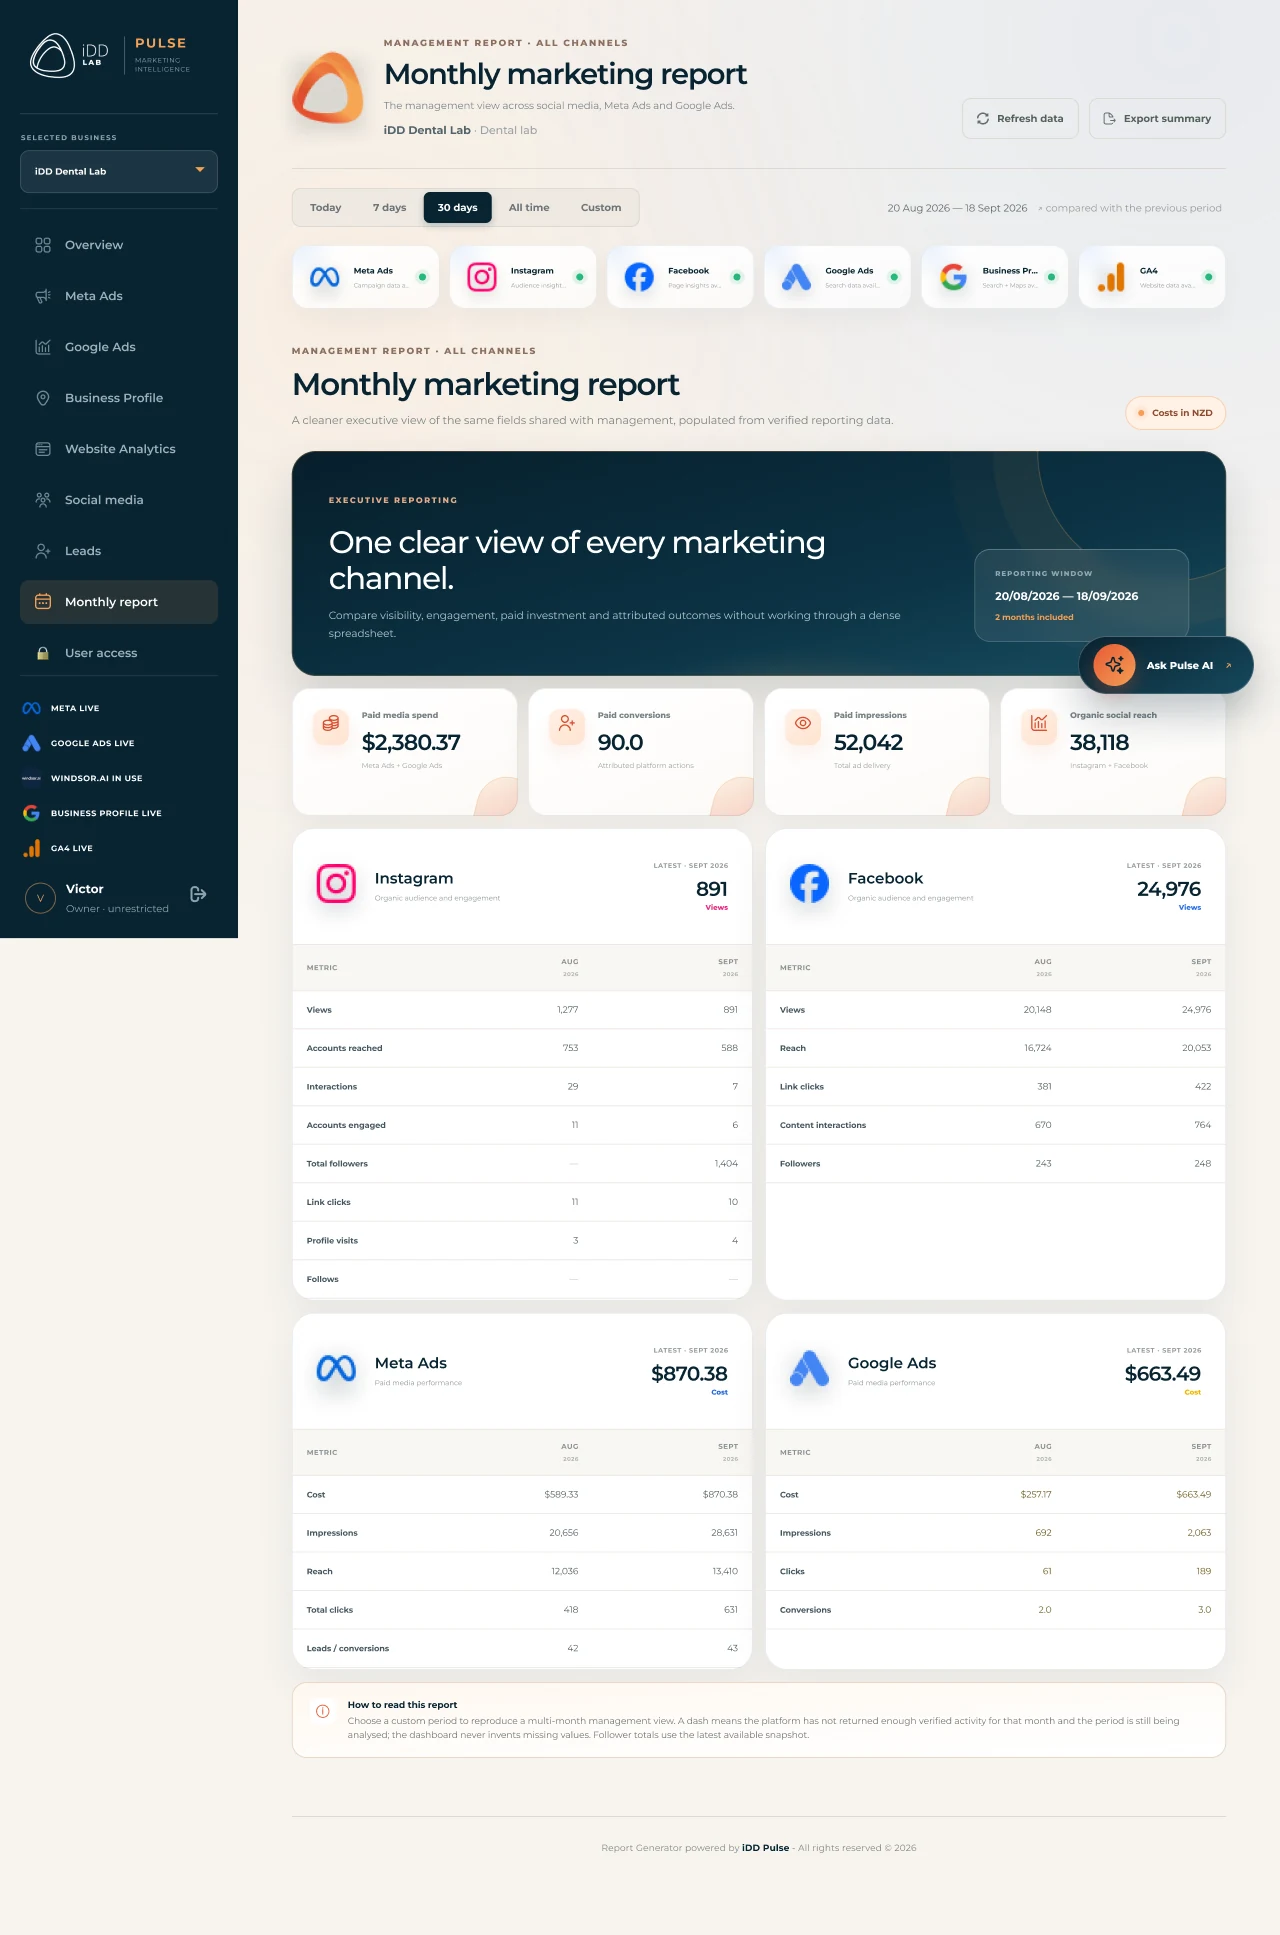
The executive overview connects channel status, performance summaries and the selected reporting period. Dedicated views give advertising, local discovery, website activity and social media room for their own questions.
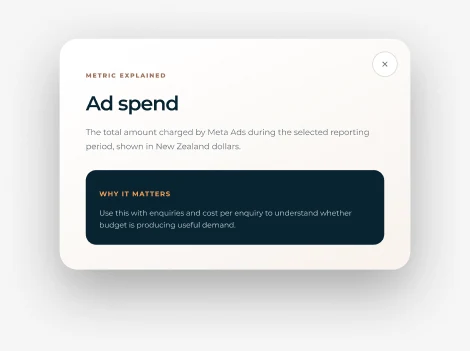
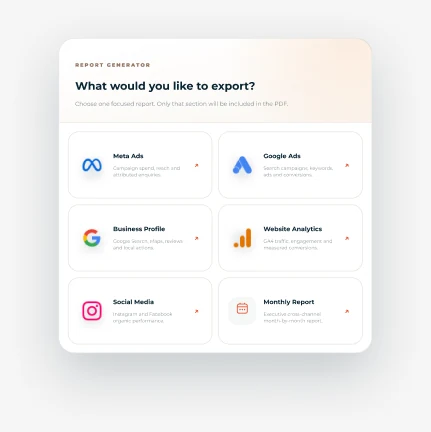
This is a gallery of Figma screen exports. Values shown illustrate the interface and are not project impact metrics.
Understanding the number, then using it
A metric explanation makes terminology easier to approach. Monthly reports and export controls support the work that follows a review, while the lead flow provides a place to record enquiries.
04 / PULSE AI
Keep the question
beside the evidence.
Pulse AI is available inside the workspace, with the selected business and period in view. Suggested questions help users begin, and the interface explains that responses use the dashboard data currently selected.
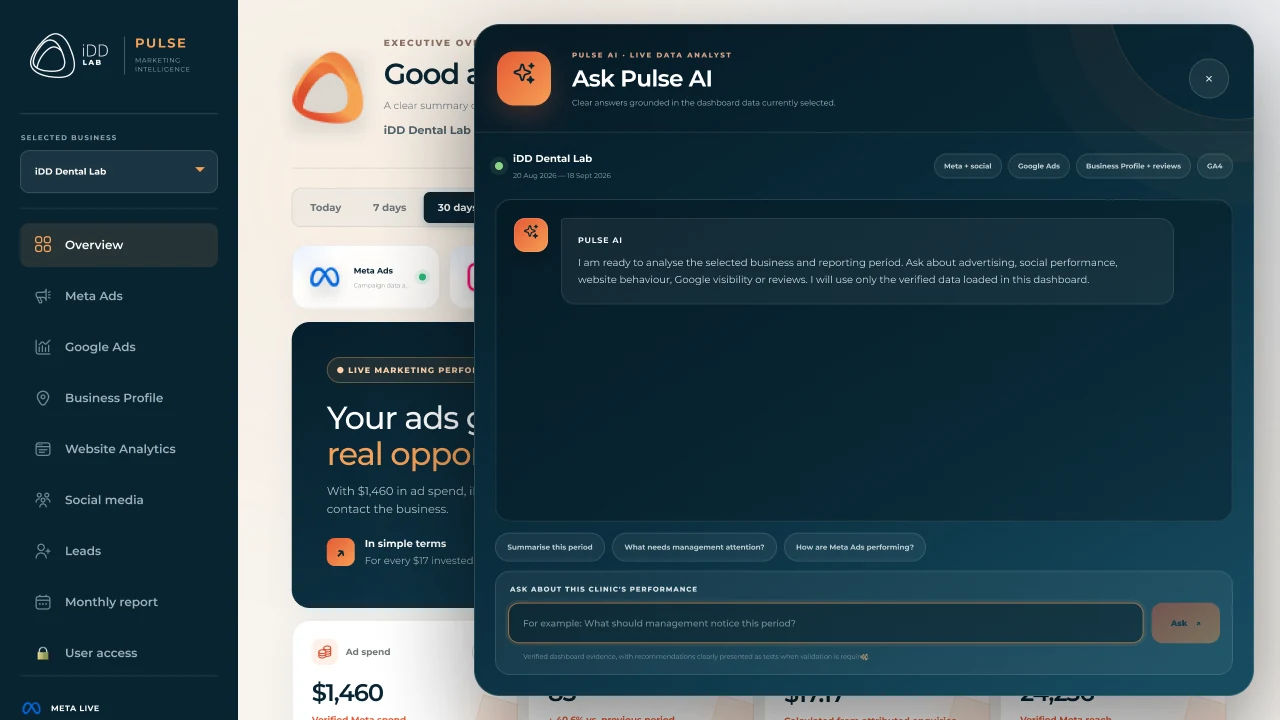
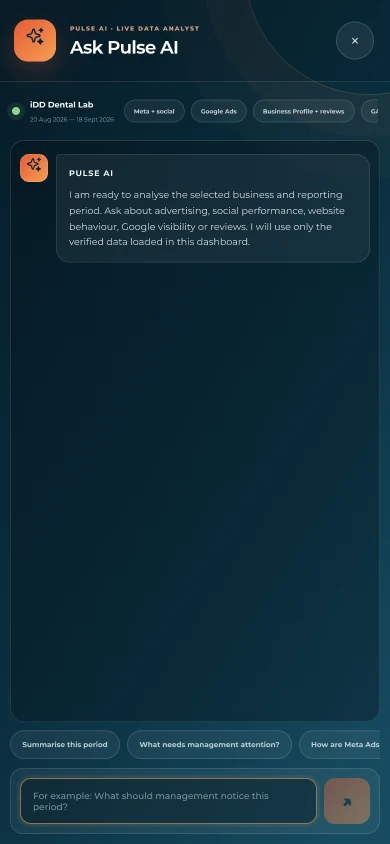
The desktop panel lets the underlying workspace remain visible. On mobile, the assistant takes the full screen so the conversation has enough room.
These screens demonstrate interaction design. They do not establish the accuracy of AI answers or measured improvements in decision-making.
05 / ACROSS SCREENS
The same context.
A different rhythm.
Desktop offers room for side-by-side summaries. Mobile turns the same information into a vertical sequence, with a dedicated full-screen view for the assistant.
A shared visual language
Montserrat, deep navy surfaces, warm orange accents and consistent controls connect the product across businesses and channels. The Figma system separates foundations, reusable components, desktop screens and mobile screens.
06 / DELIVERY & REFLECTION
A connected product,
documented in detail.
The supplied design package documents the product structure, responsive behaviour and assistant entry points.
- 20Core desktop and mobile screens
- 10Supporting interface states
- 18Composed AI-open views
The outcome shown here is the product and its design system. Time saved, conversion uplift, ROI and adoption have not been measured in this case study.
What I would validate next
- Can users choose the correct business and reporting period?
- Can they identify a channel worth investigating and explain why?
- Can they locate an enquiry and prepare a monthly report?
- Does Pulse AI distinguish evidence, recommendations and missing data?
Design evidence and scope
Images are Figma exports and explicitly composed AI-open states. They are not a new verification of the live application. Business Profile and Website Analytics views are present. Google Search Console belongs to the product vision; its delivered integration is not established by this material.
No interviews, usability studies or launch date are claimed. Contact lists, account access forms and example credentials are excluded from the public image selection.
“Centralising data only helps when the interface keeps its context clear.”
The most useful decision was connecting a simple overview with channel detail and operational tools. It gives people a path from a broad question to the evidence behind it.
NEXT PROJECT
MFIT Personal ↗
A business tool for personal trainers.